Map Editor User Guide - Layers
|
Installation Feature LayerStyles Effects Drop Shadow |
Each map can contain a number of layers which are displayed overlaid on each other.
Typically you would have one layer for each theme or group of related features. Thus a
world map might have a background layer showing the world coastline, a layer showing major
cities and a layer with a graticule. Layers can be reordered or hidden from view using the
map inspector. You can also change the opacity of layers to allow layers below to show
through. It is also possible to add effects to layers after they are
drawn.
Layers can be created from the layer control panel or by importing from a file. When you import a file, you will usually (depending on the file format) get a new layer to hold the layer data. Saving such a layer will save a reference to the file it was imported from rather than saving the data itself. You can "break" the reference by taking the layer off-line, in which case the data will be saved with your map and you will be able to edit it. There are several types of layer, for example:
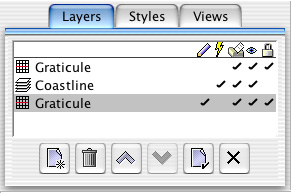
Working with LayersLayers are manipulated in the layer control panel which appears at the left of the map window. This can be shown or hidden by clicking on the toolbar button or by invoking the "Map Inspector" menu item. The layer control panel shows a list of the layers in the map with the backmost layer at the top of the list. To the right are five columns of ticks showing properties of each layer. You can click on these ticks to change the properties.
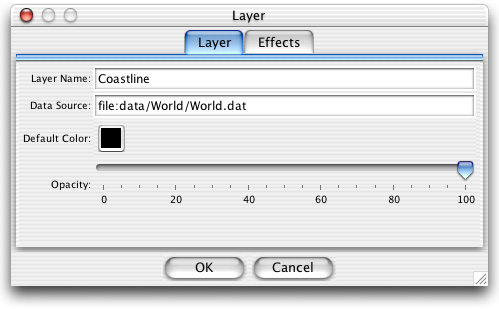
The layers panel At any time one layer, called the "active layer" is active for drawing or selecting. To set the active layer, just click on it in the layer control panel. The pencil icon indicates the active layer. The eye icon indicates whether the layer is visible or not. You may want to hide layers to make your maps clearer while you're working on them or to make them draw faster. The printer icon indicates whether the layer is printable. If unchecked, the layer won't be printed. You can lock layers to prevent them from being edited. This is indicated by the padlock icon. Finally, the "flash" icon indicates whether a layer is "live" or not. This only applies to layers which have a dynamic data source, such as a vector server. When a layer is live, features are fetched from the server as you pan and zoom round the map. These features can't be edited as they disappear when they go out of view, and won't be saved in save files. You can turn off the live layer behaviour by unchecking this column. When you do this, the current set of visible features will be frozen and you will be able to edit or save them. When you change view, however, no new features will become visible from the data source. You can make the layer live again at any time by checking this column again. Editing a LayerIn order to change the properties of a layer you can double-click on it in the layer list or press the "Edit" button. This displays the layer properties dialog which looks like this:
The layer editing dialog The "Layer" tab contains properties common to all types of layer and always exists whereas the other tabs will depend on the type of layer and the installed plugins. The name of the layer is a name which you give to it and which is displayed in the layers panel. The "data source" represents the source of the data to be displayed in the layer if the layer has a dynamic source. This is a URL which points to the file containing the layer data. You can change the opacity of a layer using the opacity slider. This is useful for showing backgrounds through images or contour plots.
|